

by Shadi Yousefi and Ilia Farahani
Originally Published in Urban Research & Practice
To cite: Yousefi, S. and Farahani, I. (2019). Spatial Inequality in Tehran, a Structural Explanation. Urban Research and Practice. DOI: 10.1080/17535069.2019.1699596
This study presents a political economic analysis of spatial inequality in Tehran focusing on four sectors of social reproduction, namely, housing, healthcare, education, and transportation. The study argues that spatial inequality is rooted in the peculiarities of Iranian capitalism. Struggling with low productivity, the manufacturing sector needs wages to remain low and unemployment to remain high in order to maintain profits. Bringing urban amenities and resources into the market is the second strategy, a process facilitated by the state. The study also discusses the role of the luxury market in neutralising the anticipated negative feedback mechanism of low effective demand.
Introduction
This study investigates economic structures behind spatial inequality in Tehran focusing on four sectors of social reproduction, namely, housing, healthcare, education, and transportation. Spatial inequality refers to unequal access to resources/amenities due to unequal distribution of income. Spatial inequality is not only a major issue for citizens, as demands for affordable housing, universal healthcare and education, and decent jobs have always been reflected in slogans during protests, demonstrations, or strikes1. It is also a challenge for urban planners and politicians and a subject for academic inquiry.
Possible causes and solutions have been discussed in official reports and academic studies, which focus on issues including bad policies, poor management, and undemocratic decision-making (Etemad 2016a; Momeni 2016; Ghaninejad 2008; Raisdana 2001, 2016a). However, a political economic analysis of systematic patterns of exclusions of the lower socio-economic strata in Tehran is yet to be addressed. We argue that such an analysis is required to explain structural constraints for better and more equitable policies and planning.
In this paper, we outline an alternative approach to existing explanations: a structural critique of Iranian capitalism by shedding light on the distinction between (a) a decommodified public economy in which prices of services are set administratively; and (b) a commodified state economy in which prices of services are set in the market. Our hypothesis is that spatial inequality is caused by dynamisms of capital accumulation and in its specific Iranian context.
The paper is designed in two parts. Part 1 discusses and visualises the extent of spatial inequality in the above-mentioned sectors of social reproduction. Part 2 presents reasons for spatial inequality and includes rival models of potential explanations of the problem. A proposed alternative framework for structural analysis of spatial inequality in Tehran is subsequently presented.
Part I. Spatial inequality in Tehran
Part 1 of the paper is concerned with the extent of spatial inequality in the city and ways in which spatial inequality has spread across the four sectors of housing, healthcare, education, and transportation.
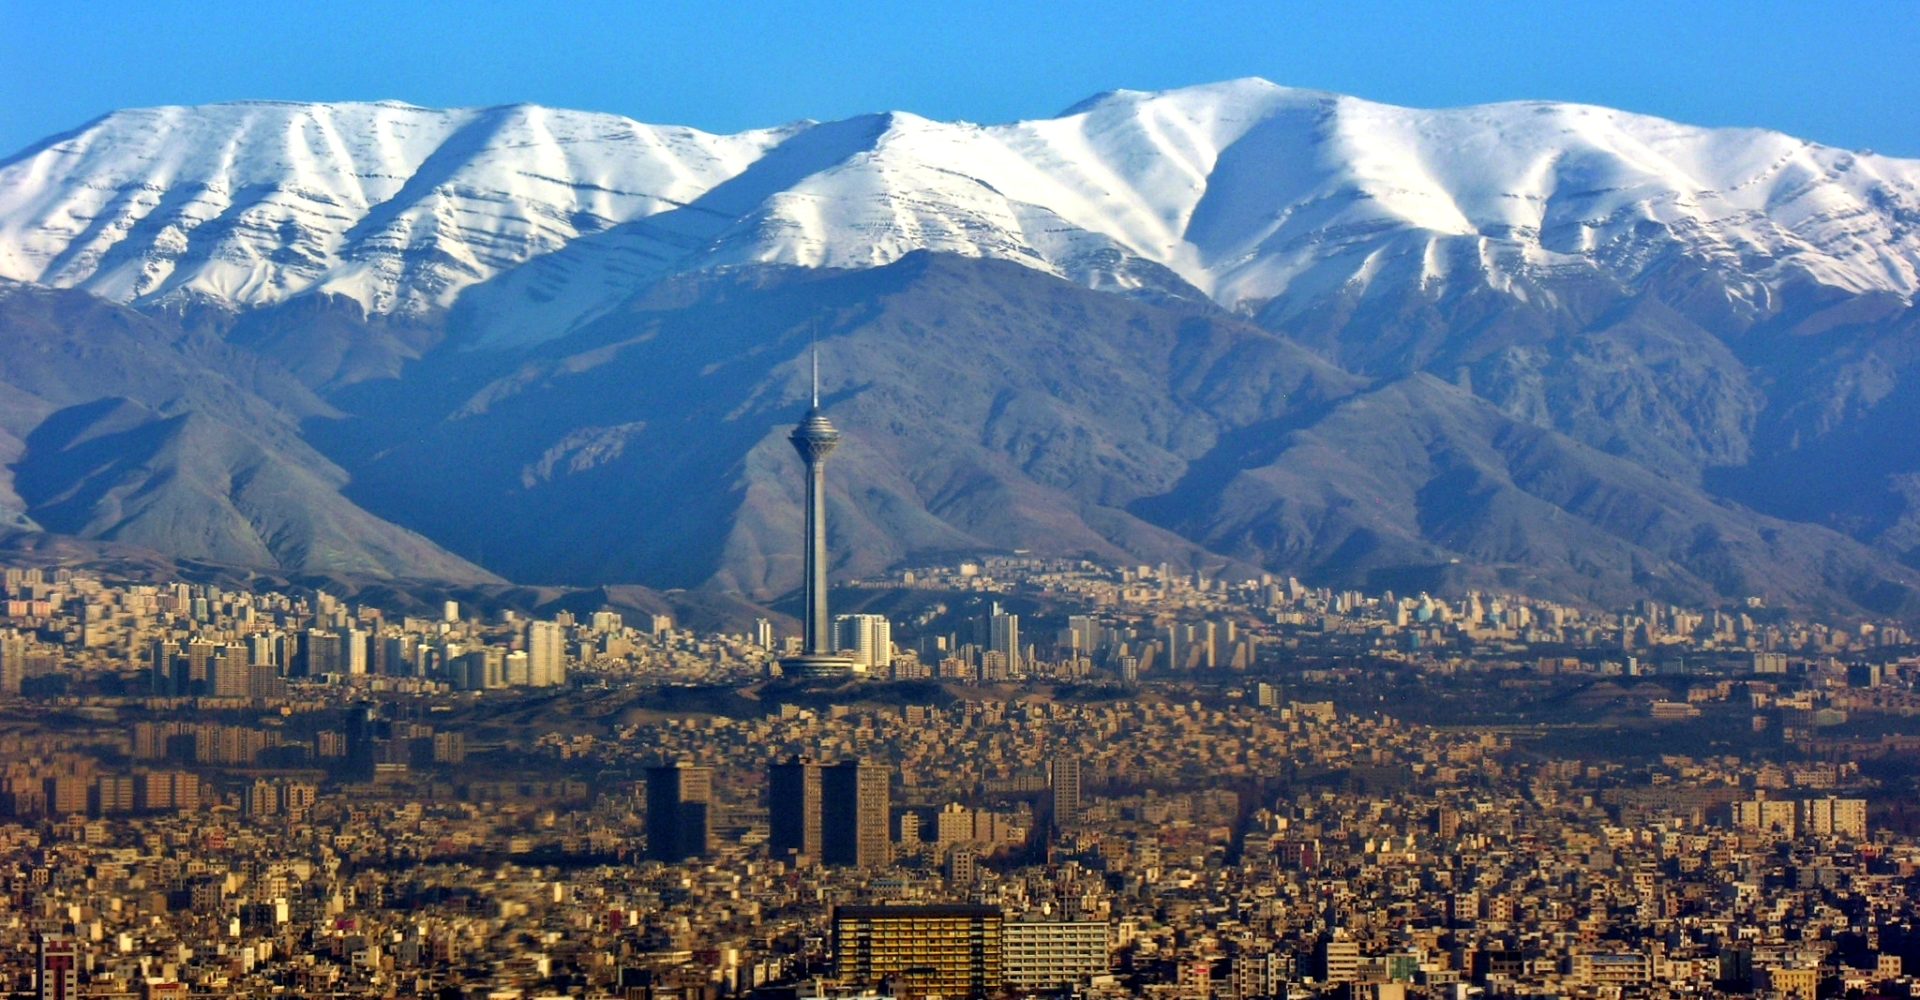
The urban population in Iran is as high as 73.4% (The World Bank 2016). Tehran, the capital city of Iran, is ranked the 23rd most populated city and urban area of the world (World Atlas 2016). Greater Tehran hosts a total population of approximately 12 million people (about 16% of the country’s population), of which 8.4 million reside in the city (the rest are mainly commuting workers from suburban areas, neighbouring cities, and satellite towns) (TMICTO 2014-2015; World Atlas 2016). The city has the largest share of the total national GDP by about 24%2, while its GDP per capita is 1.4 times larger than the national level (TCCIMA 2017). Tehran is located in the northern centre of the country and extends over an area of approximately 700 km2 (TMICTO 2014-2015). The central state is also located in Tehran and includes almost all administrative organisations and institutions as well as headquarters of financial institutions, such as banks, stock market, insurance companies, etc. All this points to the significance of studying inequality in Tehran and helps estimate the extent of inequality at the national level.
The average monthly cost of living in Tehran for an average 3.44-sized household in 2014 was 40.9 million IRR, while the minimum wage was just 8.1 million IRR per month (IRNA 2016; TCCIMA 2014). The official poverty line was reported at 23 million IRR (IPRC 2016). The gap between minimum wage, poverty line, and average living costs indicates structural poverty especially amongst workers, 70% of whom are on minimum wage nationwide (Khodaei 2018). Only 23% of Tehran’s population lives in better-off districts (districts 6, 1, 3, 2, and 7), while over 60% lives in worse-off districts (Donya-e-Eqtesad 2016)3.
As per official data, the average Gini coefficient (income) for Tehran is about 35 (MPOT 2014). As important as the Gini coefficient index is for indicating the gap between the level of income of the richest and the poorest deciles, it does not reflect the accessibility of resources. Besides, in the case of Tehran, there are no data (or at least no available data) that gather real income, assets, and wealth.
Housing
Housing is a largely privatised sector in Iranian cities, and the most privatised of the four sectors discussed here (Raisdana 2001). The municipality has never had any duty in this field (Bharier 1971; Raisdana 2001; Sadvandian and Etehadieh 1989; Tehran Municipality 2019). Housing construction and development is mostly conducted by individual owners of the land, realtors (and small-scale developers), and a handful of corporate developers (who focus mainly on building condominiums). Historically, the army and some industries had built townships for their employees. In general, however, individual ownership is dominant, the market regulates prices and rents, and the rate of return could go as high as 40-50% with an average of 15-20% over the last three decades according to official data (CBI 2013; Raisdana 2001). There is also no provision for rental (or low income) housing. The only attempt to produce public housing of sorts ever was made by the Ahmadinejad administration (i.e. Mehr Housing Project), which failed to reach its goals and was eventually cancelled by the Rouhani administration.
Tehran Municipality assumes an administrative role in the housing sector while systematically outsourcing development projects. Outsourcing involves ‘floor space ratio (FSR) allowance’ as a payment mechanism for the municipality to the developers. FSR allowances authorises developers to build above the height allowed by law for a given neighbourhood (MRUD 2017; Samair 2018). The municipality’s dependency on outsourcing development projects and FSR allowances, therefore, is crucial in understanding market-based strategic planning.
Demolishing and rebuilding a block, therefore, follows FSR for each neighbourhood (determined by the average value of the area), unless the municipality allows developers to do so otherwise (Raisdana 2002). In such cases, FSR allowances play a significant part in deals between the municipality and subcontractors.
Lack of public (low income and/or affordable) housing keeps housing expenses rather high. Housing expenses in Tehran make up 48% of the average household expenses and are 2.2 times higher than the national average (CBI 2017; TMICTO 2014-2015). Housing expenses make up to 100% of working families’ initial disposable income; six million working families live in rentals (Raisdana 2001; SCI 2017). Housing expenses indicate levels of income and are therefore crucial in understanding patterns of spatial inequality in the city. As there are no official data reflecting the distribution of income, we use geographical patterns of housing prices as an index for testing spatial inequality.
Official data indicates that, in 2016, district 18 hosted the lowest average price of dwellings by about 20 million IRR per m2 (cf. the minimum wage is 8.1 million IRR a month) and district 1 hosted the most expensive dwellings by about 80 million IRR per m2. However, according to realtors’ daily updated websites, in 2016, prices ranged between 140 to 250 million IRR per m2 in the northern parts of the city (district 1 and 3 for example) (www.iranfile.ir; www.melkeman.com). Based on average prices per m2 in each district, Map 1a depicts the distribution of housing prices in the city. Although official data only shows average prices and fails to consider the gap in prices within districts, spatially speaking, there is still a considerable difference between northern and southern Tehran. Low-income citizens are concentrated in the southern and western ends of the city.
Map 1. (a) Housing prices in Tehran 22 municipality districts; (b) General hospitals beds, population density; (c) State-owned general hospital beds, population density.

Lack of regulation in the housing market opens the door to corruption, which for many Iranian researchers, is the crux of the critique of the central government’s ineffective take on the housing question (see Part 2 below). However, market-based planning and profit-seeking policy-making instead of needs-assessment seem to be the overlooked cause. An area of 700 km2 and a population of more than 12 million make Tehran a very densely populated city. In addition, the city is characterised by limited public transportation and centralisation of economic and administrative institutions in the north and the centre with higher land values.
Healthcare
According to the WHOQOL-BREF, viable access to healthcare is an indicator of the quality of life. Tehran Province hosts 18% of all hospitals in the country, of which 51% are state-owned (cf. their 73% share nationwide and 46% in the city) (TCCIMA 2017). In other words, unlike housing, healthcare is not a largely privatised sector.
The Ministry of Health and Medical Education regulates, finances, and manages all state-owned hospitals and clinics (MHME 2019). The municipality only plays the role of a facilitator (e.g. providing a land plot to hospitals for a cheaper price in areas of more need). There are, of course, several active private hospitals, laboratories, clinics, pharmacies, etc. in each district. Aside from gaps in the quality of services that public and private hospitals or clinics offer, there is arguably a crisis in terms of lack of staff, beds, machinery, etc. in state-owned hospitals (SNN 2018).
Private hospitals (in which physicians are generally stakeholders) are considerably expensive and offer better salaries to their employees and better service to their patients (Ibid.). Their concentration in better-off districts, therefore, is logical, as they need better-off customers. The existence of such a large private sector contributes a great deal to the crisis in state-owned hospitals.
Of Tehran’s population, 16.3% has never had any form of health insurance, from which 76.2% said they simply could not afford it (CBI 2010). Moreover, the country’s largest healthcare insurance company, the state-led yet privately owned Social Security Fund (funded largely through insurance premiums paid by workers), had been covering only 20-30% of healthcare costs during the last 30 years (ISNA 2013). And even this amount is compromised as it does not cover services and medications that for example are related to dermatology (including skin cancer), dentistry, or psychiatry as they are considered luxuries (Ibid.). Those who are not covered by Social Security Fund’s insurance or other two state-led companies have to obtain insurance from less affordable private firms.
Most physicians receive patients at their own private offices. Charges for a minimum 15-minute visit varies disproportionately in different districts despite the fact that there is an official fee announced each year by The Islamic Republic of Iran Medical Council, a non-governmental organisation managed by physicians and their elected delegates. The official fee sets the minimum (by definition in worse-off areas) and the fee for better-off areas could go as high as the market relations allow (IRIMC 2014; MHME, HIO 2018). Such a pattern produces a financial incentive for doctors to seek (and compete for) offices in better-off districts. Less experienced (and less affluent) general practitioners often start their careers by purchasing (or renting) offices in the areas with lower property values. As they gain more experience (and in turn, affluence), they move to better-off areas.
Different units of state-owned hospitals, especially in paraclinical as well as non-clinical services such as laboratory, pharmacies, catering, hoteling, etc. are outsourced to private subcontractors. Private suppliers and subcontractors provide medical equipment as well as instruments (ILNA 2018). Patients are largely required to pay for necessary equipment related to treatment procedures (ISNA 2017). The quality of treatment, thus, corresponds to the patient’s ability to afford the best material. The reason for all this is straightforward. Hospitals need to sustain their budgets and especially in the poorer districts, they cost more than they earn, and the state cannot afford to invest more.
We focused on general hospitals with minimum basic services because of the extent and reach of their services, including, emergency rooms, laboratories, radiography departments, and so on. Map 1b does not separate private and state-owned hospitals as there are still many areas in the city that have no (or at least very limited) access to hospitals. For some districts such as 15, 8, and 5 the number of accessible hospitals does not correspond to the density and the others (14, 15, 19, and 22) do not even have a hospital inside their borders. It should be added that some of the worse-off districts that are seemingly less populated in Map 1b, in reality, are much more populated. The reason is that population density data is calculated for the whole area and not the residential area. This is significant in case of industrial districts (like districts 21, 22) or districts with a large number of migrant and seasonal workers (like district 17).
Apart from the fact that many worse-off districts have no access to state-owned hospitals (Map 1c); the number of beds (indicates the hospital’s capacity) in worse-off districts with a certain degree of access to hospitals is considerably low, in addition, these areas are congested with traffic (Map 1c). As most hospitals are located in the middle of the city where traffic is usually heavy, commuting to them especially during rush hours is difficult and time consuming (particularly challenging in emergency cases). Realistically, even in districts with hospitals within their borders, a distance of 4 to 5 km could take a couple of hours to reach. Reaching hospitals in both emergency and non-emergency cases does not necessarily entail services. Costs of services (including hoteling), limited number of beds, long waiting time, lack of staff, and limited equipment (especially in state-owned ones) should be added to the discussion. For example, in relatively populous districts of 5, 9, 17, and 18, the number of beds is less than 150, which means that waiting times are very long.
Education
Like healthcare, the ownership of the schools is shared between state and private actors. Of the 4000 active schools in the city, 54% are state-owned and 46% are privately owned (Madreseha 2019). Interestingly though, only 12% of the total of 1.5 million students in Tehran are registered in private schools (Ibid.).
The Ministry of Education is responsible for needs-assessments, management, and development (again conducted via outsourcing) (GBE 2016). The municipality provides the land. Every municipal district has its own Bureau of Education overseen by the General Bureau of Education of Tehran (Ibid.). Each bureau is entitled to a basic fund from the Ministry of Education and the state (Ibid.). However, bureaus of education at the same time are supposed to economically sustain themselves (Ibid.). Almost 97% of the funding is used to pay salaries of employees, and only 3% remains for other expenses of public (state-owned) schools (Omidi 2015, 42). Therefore, public schools have to ask students’ families for financial support. This support, although claimed to be only partial and voluntary, is often on the schools’ off-the-record agenda, which means that the families who cannot afford it have no chance of signing up their children (Ibid.). The latter issue recently caused controversy as it was revealed that in some neighbourhoods, poor students had been denied by schools (Mehr News 2017)4.
The distribution of teachers is also unequal. Competent teachers with better portfolios often get the chance of being sent to better-off districts with better salaries and benefits. Less qualified teachers are sent to poorer districts (Azhirak 2015, 55). Working in worse-off districts becomes less desirable even for those highly and ethically motivated teachers, mostly due to very long commute times (which can be up to 4 hours daily). This pattern has been intensified by the existence of better equipped, less populated, and richer private schools that generally offer better salaries and benefits to more qualified teachers.
The number of schools in each district determines the extent of inequality in access to education in that district. According to the Ministry of Education, every student is allowed to study in schools near (or at least in the same district as) their residence (GBE 2016). We examined the number of elementary schools5 and active elementary level classrooms per 10,000 students between the ages of 7 and 12. Map 2a disproves the authorities’ claim. Some districts (16 and 17) suffer from limited access to schools while some others (1 and 3) benefit from convenient access. Map 2b depicts the density (the number of classes for every 10,000 students). In districts 10, 15, and 16 classrooms are twice as populated (30 students on an average) as compared to districts 1, 3, 8, and 9 (where the average is 15).
Map 2. (a) Number of elementary schools per 10,000 children aged 7–12; (b) Number of elementary schools’ classes per 10,000 children aged 7–12.

Transportation
Traffic congestion in Tehran has constantly been an enormous challenge for urban planners in recent decades. During rush hours, one could spend hours to get to and from the workplace (TMTO 2015). Discussions on these issues have so far been limited predominantly to managerial solutions, which are mainly in terms of physical planning, e.g. broadening roads or constructing more highways, freeways, tunnels, and bridges. There have also been efforts made to provide public transportation, including the Metro and Bus Rapid Transit (BRT) lines. Transportation is perhaps the most municipally controlled sector of the four discussed here. The municipality’s share in the bus line is a modest 29% (Ibid.). However, it maintains full control of metro lines, which are currently responsible for 18% of the total transportation in Tehran (Ibid.), and according to the mayor, is slated to increase to 50% as it is deemed more efficient, both economically and environmentally (IRNA 2019).
The central state and the municipality are both involved in the development of the metro line, 50% each (IMO 2013). The central state is responsible for providing (and almost exclusively importing) subway cars, whereas, the municipality is responsible for tunnelling, construction of the stations, electrical wiring, and so on, which are mainly outsourced (Ibid.). Outsourcing actively involves contractors and sub-contractors. Payments are generally through FSR allowances. The values of FSR allowances correspond to the value of land in a respective area.
To examine spatial distribution of modes of transportation, the accessibility of metro stations in the city is chosen. There are two reasons for this. First, the metro is a state-owned mode of transportation managed by the municipality. Second, considering the heavy traffic congestion in Tehran, being able to choose the metro as a mode of transportation could be considered an advantage.
Having access to a public mode of transportation is an issue for socio-economically vulnerable citizens. Map 3a shows some districts (15, 19, and 9) that do not have appropriate access to metro stations; there is no metro station near these areas, and people cannot reach stations in less than twenty minutes. As there are always buses, taxis, and other modes of transportation to reach metro stations, we performed a cost-distance analysis for driving distance to metro stations. Map 3b shows that for the residents of some districts (14, 18, 19, and 15), using the metro is not an option.
Map 3. (a) 10- and 20-minutes walking distance towards metro stations; (b) Driving distance to metro stations.

Part II. Explanations
This section discusses reasons for market-based urban planning in Tehran and its subsequent spatial inequality, presented through two rival models.
A survey of previous studies
Spatial inequality in Tehran has been a topic of interest for Iranian geographers and economists from different perspectives. For economist Fariborz Raisdana and urban planner Giti Etemad the problem is mainly ineffective policies, corruption, and inadequate regulations (Etemad 2016a, 2016b; Raisdana 2002, 2016a). For outspoken neoliberal economists like Mousa Ghaninejad (2008), spatial inequality is a matter of excessive state intervention, malfunctioning and circumscribed privatisation, and an unfree market.
Both Raisdana and Etemad are prominent for their critiques of the Iranian state as well as their call for systemic change. Their analyses have earned them a distinguished position among Iranian social scientists, who are largely directly or indirectly affiliated to factions of the Iranian regime.
Raisdana blames ‘bad policy’ and bureaucratic corruption as drivers of inequality. While discussing uneven urban development in Tehran, Raisdana criticises undemocratic urban planning dependent on nationalised oil income by the central state instead of development and productive economic activity (Raisdana 2002, 233). As for housing shortages in the city, Raisdana calls for democratic state regulation in housing provision and blames undemocratic state control, chaotic privatisations, and a limited chance of foreign investment due to undemocratic centralised state control (Raisdana 2016a).
For Etemad, ineffective management and lack of comprehensive planning in Tehran’s municipality drives uneven urban development (Etemad 2016a). Etemad further criticises chaotic policy-making at local and municipal levels, where, the districts, on one hand, and the governor and governor-general on the other, make decisions based on needs of their areas of responsibility instead of following a comprehensive plan that regards the city as a unified target (Etemad 2016b). In other words, Etemad criticises inconsistent management and lack of a competent authority. She argues that self-sufficiency of municipalities and privatisations had been followed by massive selloffs, branded as ‘city selling’ (Etemad 2016a). However, the solution remains at the level of coherent regulations and higher and systematic taxations (Ibid.).
Self-proclaimed institutionalist economist Farshad Momeni (2016) targets bureaucratic corruption, unequal income distribution, and low effective demand as main causes of social inequality in Tehran. Neoliberal economist, Ghaninejad (2008), on the other hand, calls for advances towards free market and privatisations of urban planning and governance, blaming state intervention in urban development projects as the sole reason for the underdevelopment of the city economy (Ibid.).
Discussions around the issue have so far been on the policy level. While these concerns are valid, our focus is on investigating political economic structures driving inequality, as the current explanations are deemed insufficient6.
Models: policy versus structure
We discuss two potential models to analyse a case of spatial inequality in Tehran (Figure 1). Model 1 is derived from the aforementioned existing studies of spatial inequality in Tehran by Raisdana and Etemad. According to them, the undemocratic state consistently tends to appoint incompetent planners, managers, and politicians. It thus tends to generate a regime of extensive (bureaucratic as well as financial) corruption and incompetent management, which go hand in hand in (re-)producing spatial inequalities. The model sees inequality as an outcome of political structure and poor policymaking.
Figure 1. Model 1: based on Raisdana/Etemad for spatial inequality in Tehran; Model 2: based on Harvey/Smith for the political economy of spatial inequality.

The problem with Model 1 is that such an irrational politico-economic system should have been collapsed long ago. Besides, if the problem lies in political irrationalities stemming from incompetent planners, managers, or politicians, they should have been replaced, however, the current political structure does not allow it. The model, then, should logically provide a structural explanation for systemic corruption, which it fails to do, giving rise to Model 2.
Model 2 is derived from political economic, and structural analyses of capital accumulation and its subsequent spatial inequality by Harvey ([1982] 2006, 1985, 2003, 2010) and Smith (1986, 2010). This model is useful as it sheds light on the peculiarities of Iranian capitalism, such as high unemployment or low productivity providing a structural political economic explanation that Model 1 omits.
Model 2 presents a mechanism through which capital accumulation drives spatial inequality. Uneven geographical development as ‘the continual struggle of the opposed tendencies toward differentiation and equalization’ and the dynamics of concentration and centralisation of capital, is the spatial manifestation of capital accumulation in capitalist cities (Smith 1986, 99, 2010). Unemployment and commodification of space are two strategic wings of capital accumulation in urban space (Harvey [1982] 2006, 1985, 2010). Structural unemployment helps to reduce the value of labour power and the commodification of space helps to add new (spatial) investment opportunities. Accumulation by dispossession is the social mechanism of the commodification of space (Harvey 2003).
However, inequality could simultaneously lower the rate of effective demand. Low effective demand (and more specifically ‘social demand’ which refers to consumption, as opposed to capital demand which refers to reinvestment), subsequently, works as a negative feedback mechanism for the whole process (Harvey [1982] 2006, 89–90). As demand drops, over-production becomes unavoidable. Over-production causes over-accumulation as capital keeps accumulating but further investment and realisation of the value in the market would not be possible (Harvey 2017, 12). This is when the state can intervene, regulate the market, and provide social support for the poor (via e.g. fiscal policy) to keep social demand high enough to avoid further crises.
Explaining spatial inequality in Tehran using model 2
The study’s aim is to understand how spatial inequality is related to economic structures and why Iranian capitalism must go beyond production (primary circuit of capital) and expand commodification processes to urban space and social reproduction (secondary circuit of capital). The study also questions if the Iranian state’s market-based approach towards urban planning is a result of politically irrational decision-making or structural peculiarities of Iranian capitalism.
Concentration and centralisation of capital are two mechanisms of capital accumulation (Harvey 2010, 270; Marx 1990, 776–777). In the Iranian economy, both processes face obstacles. In the last two decades, economies of scale in the manufacturing sector have dramatically declined from 0.8 to −0.16 (Ashrafzadeh and Alaedini 2018, 64–65). International economic (and financial) collaborations have been restricted, resulting in limited foreign investment mostly because of high investment risks (Schott 2006). Moreover, limited labour-efficient technologies have lowered the productivity of capital (IMF 2015, 19). Interestingly, unlike productivity of capital, thanks to high unemployment (the official rate was reported at 12.1%) (SCI 2018)7, low wages, long working days, and systematically unorganised labour, productivity of labour doubled ‘from less than 20% of the US level in 1990 to close to 40% in 2015ʹ (CBI 2019c; IMF 2015, 19).
International politics, geopolitical regional tensions in the Middle East, and US-led sanctions over the last 40 years have played a crucial role in this crisis (Schott 2006). For the manufacturing sector to be profitable, wages have to remain low and the unemployment rate has to remain high. When and where that strategy fails, the investment tends to shift to social reproduction sectors (including housing, healthcare, education, and transportation). This allows aggregate capital to continue accumulating. The role of the state, thus, is more of a facilitator in such a process. That is why the state (and its different organs) help businesses keep wages low and outsource development projects to subcontractors, paid through FSR allowances, to facilitate the investment in social reproduction sectors. The Iranian state must intervene not as a regulator but a facilitator to postpone the crisis of Iranian capitalism. Spatial inequality is the inevitable outcome that both the state and the capitalists need to reproduce in order to function.
Low wages and high unemployment are vital for Iranian capitalism on account of limited labour-efficient technology and inability of capital to extract relative surplus value. Capital is practically forced to move for extracting absolute surplus value (prolonging working days up to 2–3 shifts a day in some sectors, such as the auto industry) on one hand, and lower wages to one-third of the poverty line, on the other. A fundamental mechanism for lowering wages is high unemployment (12%) and an increase in the so-called reserve army of labour. The high rate of unemployment, in both national and city levels, contributes a great deal to further accumulation by reducing unit labour costs and decreasing real wage relative to productivity (Shaikh 2016, 651).
The second strategy for Iranian capitalism has been to expand the market to urban space, and more importantly, to social reproduction through the commodification of housing and the semi-commodification of healthcare, education, and transportation. The commodification of urban space as a process of appropriating all spaces that were previously not on the market or are not inherently market commodities explains such a tendency (Harvey [1982] 2006, 1985). As for Iranian capitalism, the above-mentioned sectors of social reproduction are brought into the market to make up for underperforming and low profit manufacturing sector. They are being commodified (at least to some extent) to restore the rate of profit, which explains the existence of excess profit in real estate services.
The excessively high value of land points to the existence of land rent and possible monopoly pricing and land speculation. The latter itself is evident in a quarter of a million vacant units in the city (Raisdana 2001). However, the rate of rent is determined by inter-sectoral dynamics between construction and manufacturing sectors as the crisis of profitability in the latter (due to limited import of labour-efficient technologies because of sanctions) and excess profit in the former lead many industrialists to shift to invest in urban spaces seeking rent. The return rate (net output minus depreciation divided by net capital stock) in real estate services has been consistently 20–30 times larger than manufacturing, while the private sector’s capital formation in machinery is 2–3 times lower than construction in the last four decades (CBI 2016, 2019b).
Market-based planning is the main urban strategy used by the state to slow down the persistent profitability crisis in the manufacturing sector by facilitating the extraction of rent. Although this type of rent (absolute rent) has been neglected in urban geography literature (Ball 1985, 2007 [1986], 165; Evans 1999, 2116–2117; Harvey and Chatterjee 1974; Jäger 2003, 236; Ward and Aalbers 2016, 1762), the peculiarities of the Iranian case point to its relevance.
In Model 2, these processes are explained through mechanisms of uneven geographical development and accumulation by dispossession. Uneven geographical development is the spatio-economic mechanism of the process of expansion of the market into social reproduction sectors (Smith 2010, 197–198). This mechanism needs to be elaborated in the case of Tehran. It is true that unlike southern districts, northern districts are flourishing. However, it seems like the process is a one-way street in Tehran. The fact that the residents of northern and central districts with the highest land and housing prices benefit from all possible urban amenities that residents of southern and western districts are deprived of is telling, as far as capital accumulation is concerned. This process, however, is subject to change. Investment, as seen in the case of Tirajeh 2 and other similar malls, has started to shift to the southern parts of the city and is pushing people further to the edge of town, initiating the dispersal process with more intensive investment.
Accumulation by dispossession is the social mechanism of a similar process (Harvey 2003). The central state facilitates the flow of capital into housing, healthcare, education, and transportation by putting them into the market (Harvey [1982] 2006, 236). Urban space in Tehran is being commodified through massive investments in different parts of the city – such as road expansions, high school complexes, new hospitals, and gigantic shopping malls. The important factor is to seize nationalised lands and allocate them to de facto users for profitable private investment.
The strategy of ‘upgrading the urban built environment according to the preferences of affluent citizens’ is very telling in the example of the Tirajeh 2 shopping mall in district 8 (Krätke 2014, 1669). At first, it is obvious that the location is desirable because the required land plot is cheap. However, it is located in a poor area that could make investment problematic; locals cannot afford shopping at the mall. The solution was found in investment in a highway connecting the north of the city (rich neighbourhoods) to the new shopping mall without any traffic congestion. Therefore, investors can secure their profit. This is possible at the expense of dislocation of hundreds of local residents, who are pushed into cheaper neighbourhoods due to increases in average property values – from 10 million IRR per m2 to 30 million IRR in the first four years of opening to 70 million IRR in 2019.
Effective demand and modifying model 2
Theoretically, one significant impact of such a high rate of unemployment and low wage levels could be on effective demand. Low effective demand could potentially perform as a negative feedback mechanism to further accumulation: inability to consume by millions of citizens intensifies not just over-production but also over-accumulation (i.e. shrinking investment opportunities). Slopping social (i.e. labour) demand calls for state intervention to regulate the market and avoid deepening crisis (see Model 2). With the help of different types of regulations (fiscal policy and taxation), the central state could try to keep purchasing power high enough so that effective demand will remain at least constant and the process of capital accumulation stays alive.
That, however, is not currently happening in the Iranian economy. It is even reflected in the official data that the ratio of income for the top 10% of the population to the lowest 10% is 12 (TCCIMA 2014). Some semi-independent scholars, however, say that the total expenditure of the richest 8% of the population is 45 times higher than the poorest 15% of the population (Ansari 2015, 34). Total gross expenditure of the lowest decile is five times lower than the national average, while it is 3 times higher than the national average for the highest decile (CBI 2017). In other words, while a sizable part of the population experiences severely poor living standards, the other side of the city (the super-rich) enjoys a luxurious life.
Especially in the last 10 years, and while the country was under severe economic sanctions, the consumption of luxury products hit new heights. In only four years, between 2011 and 2015, four luxury shopping centres have opened. Two of these shopping centres (Sam Center and Palladium) are located in district 1. Interestingly, one of them (Tirajeh 2) is in a low-income neighbourhood. There are media reports that the target consumer group of Tirajeh 2 are outspokenly not residents of the neighbouring areas (Morahem 2015). The new highway next to the mall is expected to provide access to non-local consumers who will not need to enter the neighbourhood (Ibid.).
The same goes for luxury housing, mostly located in districts 1 and 3, with no clear price tags (www.tehranlux.com). Two-seater private jets – at least 200 registered by IRICA are also common (Mehr News 2017). In 2013, it was reported that the import of luxury cars was the second highest yielding import businesses in Iran (Taraz News 2013). It was ranked fourth of all imports by IRICA after rice, soy, corn, and wheat (IRICA 2013). In 2016, a total of 392 Porsche cars were registered by IRICA (IRICA 2016). Overall, consumer products (excluding basic goods) imports have shown a dramatic increase in the last 4 decades (Figure 2), of which at least since 2004 on average 10% (10–12 billion USD) are imports of luxury products (CBI 2019a)8.
Figure 2. Consumer products, imports. Source: (CBI 2019a).

In the case of Tehran, considering the aforementioned political economic limitations (including low profitability in the manufacturing sector), the state functions as a catalyst for the process of commodification of urban space and allows capital to flow onto land to extract rent. The problem of low social demand should be present. In fact, the level of consumption within poorer groups of residents of Tehran is decreasing. Yet, it is not evident if Iranian capitalism is actually suffering from this condition. The reason is that the target for demand has shifted towards luxury consumption. Thus, the aggregate demand simply did not fall (Figure 3(a,b)), which itself means a low level of demand among the poor does not perform as a negative feedback mechanism. The high demand for the luxury market stimulates the process of accumulation in the city by boosting investment in the urban space and making further marketisation even more rational. Iranian capitalism benefits from the marginalisation of the poor.
Figure 3. Aggregate demand and aggregate consumption expenditures. Source: (CBI 2019b).

Figure 4. Model 2 modified for the political economy of spatial inequality in Tehran.

This is of course in contrast to what one could deduct from Model 2 on the outcomes of the commodification of space and the role of effective demand. Model 2 indicates that it is for capitalism’s own good to stop lowering demand among the poor as it could contribute to more crises. However, this does not seem to be the case for Iranian capitalism. It seems that in Tehran, capitalism can overcome potential impacts of low demand by developing a luxury market. The theoretical model for the present study is therefore modified to accommodate this fact by turning the focus from consumption to production and the regional peculiarities and necessities of capital accumulation (see Figure 4). An alternative model for Iranian capital accumulation, its expansion into urban space, and its resulting spatial inequality, therefore, is as follows:
Conclusion
Many Iranian social scientists analyse spatial inequality in Tehran by criticising the undemocratic state, poor management, and corruption. The present study, in contrast, draws attention to political economic structures of spatial inequality, specific (though not exclusive) to Iranian capitalism and argues that spatial inequality needs to be understood in relation to other aspects of the economy.
In order to understand the extent of spatial inequality in Tehran, four sectors of social reproduction are analysed. The study finds that the better-off northern and central districts, accommodating residents with the highest level of income, contain most of the primary schools, general hospitals, and metro stations. In contrast, the worse-off southern and western districts, accommodating residents with the lowest level of income, are severely suffering from the lack thereof. This means the extent of inequality is correlated to the affluence of the residents of a given district. This argument is common between the two models discussed here.
As far as the private sector is concerned market-based urban planning, i.e. to invest more intensively in more affluent areas, is an economically rational choice. But the reason the state-owned hospitals or schools also apply it lies particularly in the way those sectors are managed and funded in Tehran. Schools and hospitals are dependent on external funding coming mainly from students’ families or patients. Therefore, they also prefer to invest in areas where people can afford to pay. More importantly, the co-existence of private and state-owned sectors increases inequality, as more experienced teachers/nurses/doctors prefer to work for the private sector that offers better salaries and benefits.
Spatial inequality is rooted in the peculiarities of Iranian capitalism. The manufacturing sector is suffering from limited labour-efficient technologies and low productivity of capital (partly due to long-term sanctions on import of technology). The state, in response, has to facilitate capital mobility and private investment in urban amenities/services. Low wages and high unemployment are crucial for manufacturing sector and the state to sustain profits. Here is where the state’s brutal suppression of organised labour comes in. In order to maintain Iranian capitalism, the state not only fails to intervene for social security and welfare but also suppresses the labour movement for further marketisation and intensifying inequality. In urban spaces, marketisation of everything is vital and a largely limited public economy helps a great deal.
The main problem with existing explanations of inequality in Tehran is that they envision an ideal/perfect form of capitalism. Capitalist development is never ideal, but rather highly variegated (Peck and Theodore 2007). In this paper, we attempt to present a realistic portrait of Iranian capitalism and the structural spatial inequality it feeds on to maintain profits.
Acknowledgments
We would like to thank our colleagues at Lund University Henrik Gutzon Larsen, T. S. Faran, Eric Clark, and Monica Keaney who read and commented on various drafts of the paper. Thank you to Urban Research and Practice editor Rob Atkinson and two anonymous reviewers.
Disclosure statement
No potential conflict of interest was reported by the authors.
Notes
2. The share of the second largest city–Isfahan–is just 3.75% (Iran Economy Online 2015).
3. We delimit our study on administrative borders of districts and not smaller units such as neighbourhoods for two reasons: first, the availability of the official data and second, that it still reflects a considerable level of inequality.
4. In only one example, 25,000 children of school age are informally employed in Tehran, of which only 1,500 are attending school (ILNA 2015).
5. Primary education is considered as the least basic need for residents, according to the UN Millennium Development Goals (UNMDGs 2015).
6. An important approach excluded from this survey is topography and the analysis of impacts of physical geographic structures on top-down planning processes, and thus, on social and economic inequality. This inequality is ultimately responsible for ‘the vertical axis of social promotion’ in Tehran, especially following land reforms of 1963 (Grigor 2016, 360). This approach is not within the scope of the present paper. However, it is an important issue to be addressed elsewhere.
7. The unofficial unemployment rate, however, is somewhere around 24% (Raisdana 2016b). It must be noted that since official data is largely moderated, accurate quantitative analysis of data is impossible. Our alternative strategy is to descriptively analyse the official data–which nonetheless reflect a significant social inequality, assuming the actual situation is far worse.
8. The booming market for luxury and conspicuous consumption has also been reflected in international media (Business Insider 2018; Forbes 2017; The Guardian 2015; Weekly Standard 2018).
References
-
- Ansari, A. 2015. “نابرابری های آموزشی در حال تشدید است [Educational Inequalities are Increasing].” Shargh Special Issue: Economics 2529: 34–37.
-
- Ashrafzadeh, H. R., and P. Alaedini. 2018. ‘Manufacturing exports and employment in Iran: the role of economies of scale and human capital’. In Industrial, trade, and employment policies in Iran, edited by Alaedini, P., and Razavi, M., 55–76. Cham: Springer.
-
- Azhirak, Z. 2015. “عدالت آموزشی یک چالش فراگیر [Education Justice, a Big Challenge].” Shargh Special Issue: Economics. 2529: 55–56.
-
- Ball, M. 1985. “The Urban Rent Question.” Environment and Planning A 17 (4): 503–525. doi:10.1068/a170503.
-
- Ball, M. 2007 [1986]. “On Marx’s Theory of Agricultural Rent: A Reply to Ben Fine.” Economy and Society 9 (3): 304–326.
-
- Bharier, J. 1971. Economic Development in Iran 1900-1970. London: Oxford University Press.
-
- Business Insider. 2018. “The Extravagant Lives of the ‘rich Kids of Tehran’ are Fueling Iran’s Protests — Take a Look.” January 6. Accessed 16 January 2018. http://nordic.businessinsider.com/iran-protests-rich-kids-of-tehran-2018-1/
-
- CBI. 2013. “Annual National Accounts.” Accessed 27 November 2018. https://www.cbi.ir/simplelist/5796.aspx
-
- CBI. 2016. “Economic Report and Balance Sheet.” Accessed 20 March 2019. https://www.cbi.ir/category/EconomicReport_en.aspx
-
- CBI. 2017. “نتایج بررسی بودجه خانوار [Household Budget Survey].” Accessed 19 March 2019. https://cbi.ir/simplelist/1600.aspx
-
- CBI. 2019a. “Economic Time Series Database.” Accessed 20 March 2019. https://tsd.cbi.ir/Display/Content.aspx
-
- CBI. 2019b. “National Expenditure at Current Prices.” Accessed 20 March 2019. https://cbi.ir/simplelist/5796.aspx
-
- CBI. 2019c. “Productivity Index.” Accessed 20 March 2019. https://cbi.ir/simplelist/4494.aspx
-
- CBI (Central Bank of Iran). 2010. “

 . [Households Access to Financial Services in Urban Areas, Survey 2008].” Tehran. www.cbi.ir
- CBI (Central Bank of Iran). 2010. “
-
- Donya-e-Eqtesad. 2016. “رتبه رفاه 22 منطقه تهران. [The Level of Welfare Ranking in 22 Districts of Tehran].” January 26. Accessed 11 August 2016. https://www.donya-e-eqtesad.com/fa/tiny/news-1001526
-
- Etemad, G. 2016a. “Interviewed with Nayereh Khademi. اختلال در برنامه ریزی یا شهرفروشی [Disruption of Urban Planning though City Selling].” Taadol News. March 9. Accessed 23 July 2016. http://reader.newshub.ir/news/47347051
-
- Etemad, G. 2016b. “Interview with Kelide Melli.

 . [Giti Etemad: City Councils Do Not Have an Effective Position in Urban Planning].” January 13. Accessed 23 July 2016. http://kelidemelli.com/fa/print/2465
- Etemad, G. 2016b. “Interview with Kelide Melli.
-
- Evans, A.W. 1999. “On Minimum Rents: Part 1, Marx and Absolute Rent.” Urban Studies 36 (12): 2111–2120.
-
- Forbes. 2017. “Auto Industry Tries to Persuade Iran to Change the Meaning of Luxury.” May 30. Accessed 16 January 2018. https://www.forbes.com/sites/dominicdudley/2017/05/30/auto-industry-tries-to-persuade-iran-to-change-the-meaning-of-luxury/#50e3a30b2f73
-
- GBE (General Bureau of Education). 2016. “معرفی اداره کل. [Organisational Structure].” Accessed 16August 2016. http://tehranedu.ir/Default.aspx?page=774
-
- Ghaninejad, M. 2008. “Interview with Aftab News. ایدئولوژی اقتصاد دولتی مهمترین عامل توسعه نیافتگی. [Ideology of Public Economy, the Main Cause of the Underdevelopment].” Aftab News, April 14. Accessed 23 July 2016. http://aftabnews.ir/vdcd5o05.yt0ss6a22y.html
-
- Grigor, T. 2016. “Tehran: A Revolution in Making.” In Political Landscapes of Capital Cities, edited by J. Christie, J. Bogdanović, and E. Guzmán, 347–376. Boulder: University Press of Colorado.
-
- The Guardian. 2015. “Iran under Sanctions: No Money for Medicine but Luxury Cars Aplenty.” August 26. Accessed 16 January 2018. https://www.theguardian.com/world/iran-blog/2015/aug/26/iran-medicine-money-to-buy-porsche-maserati
-
- Harvey, D. 1985. The Urbanization of Capital. Oxford: Blackwell.
-
- Harvey, D. 2003. The New Imperialism. Oxford: Oxford University Press.
-
- Harvey, D. 2010. A Companion to Marx’s Capital. London: Verso.
-
- Harvey, D. 2017. Marx, Capital and the Madness of Economic Reason. London: Profile Books.
-
- Harvey, D. [1982] 2006. The Limits to Capital. London: Verso.
-
- Harvey, D., and L. Chatterjee. 1974. “Absolute Rent and the Structuring of Space by Governmental and Financial Institutions.” Antipode 6 (1): 22–36. doi:10.1111/j.1467-8330.1974.tb00580.x.
-
- ILNA (Iranian Labour News Agency). 2015. “تهران 58 هزار بی سواد دارد. [Thousand “Illiterate” in Tehran].” December 5. Accessed 6 June 2016. https://www.ilna.news/fa/tiny/news-327212
-
- ILNA (Iranian Labour News Agency). 2018. “مصاحبه با نایب رئیس دوم کمیسیون بهداشت و درمان مجلس [Interview with the Deputy Head of the Parliament’s Health and Medical Care Commission].” September 23. Accessed 26 March 2019. https://www.ilna.news/fa/tiny/news-673055
-
- IMF (International Monetary Fund). 2015. “Islamic Republic of Iran.” IMF Staff Country Reports2015/350, 1–28.
-
- IMO (Ministry of Internal Affairs, Municipalities Organisation). 2013. “

 [Urban and Suburban Railway Provision, Executive Code].” Accessed 29 April 2019. https://tinyurl.com/st3locy
- IMO (Ministry of Internal Affairs, Municipalities Organisation). 2013. “
-
- IPRC (Islamic Parliament Research Center). 2016. “

 . [Poverty Line Is 2.3 Million Toman/Living with Current Wages is Impossible].” January 11. Accessed 26 July 2016. http://rc.majlis.ir/fa/news/show/950567
- IPRC (Islamic Parliament Research Center). 2016. “
-
- Iran Economy Online. 2015. “سهم هر استان از تولید ناخالص داخلی، تهران در صدر [GDP per Province, Tehran on Top].” October 12. Accessed 9 September 2019. http://eghtesadeiranonline.com/vdcb89b5grhb9fp.uiur.html
-
- IRICA (Islamic Republic of Iran Customs Administration). 2013. “سالنامه آماری تجارت خارجی [Annual Statistical Report- International Trade].” Accessed 16 January 2018. http://www.irica.gov.ir/Portal/file/?36121/salnameh-1392.zip
-
- IRICA (Islamic Republic of Iran Customs Administration). 2016. “واردات- جداول [Imports- Tables].” Accessed 16 January 2018. http://www.irica.gov.ir/Portal/home/?report/4599/5139/251687/1395
-
- IRIMC (Islamic Republic of Iran Medical Council). 2014. “

 . [Diagnostic and Treatment Services Tariff for Private Sector].” May 20. Accessed 16 August 2016. http://irimc.org/filemanager/privatetariff.pdf
- IRIMC (Islamic Republic of Iran Medical Council). 2014. “
-
- IRNA (Islamic Republic News Agency). 2016. “حداقل دستمزد سال 95 کارگران 14 درصد افزایش یافت. [The Workers Minimum Wage of 2015 Raised by 14%].” March 9. Accessed 16 July 2016. http://www8.irna.ir/fa/News/81995896/
-
- IRNA. 2019. “حناچی: تلاش شهرداری تهران برای افزایش سهم استفاده از مترو به 50 درصد [Mayor: ‘we Will Increase the Share of Metro in Total Transportation to 50%’].” April 7. Accessed 29 April 2019. http://www.irna.ir/tehran/fa/News/83267514
-
- ISNA (Iranian Students News Agency). 2013. “باید سهم بیمار از هزینه های درمانی را به 30 درصد برسانیم. [Patients Share of Treatment Expenses Should Become 30%].” December 20. Accessed 16 August2016. https://www.isna.ir/news/92092919974/
-
- ISNA (Iranian Students News Agency). 2017. “درمان چقدر خرج دارد [Costs of Medical Care].” April 21. Accessed 26 March 2019. https://www.isna.ir/news/96020502698/
-
- Jäger, J. 2003. “Urban Land Rent Theory: A Regulationist Perspective.” International Journal of Urban and Regional Research 27 (2): 233–249. doi:10.1111/1468-2427.00445.
-
- Khodaei, A. 2018. “Member of the Ministry of Cooperative, Labour, and Social Welfare’s Labour Council. Interview with ISNA. درباره حداقل دستمزد [On Minimum Wage].” February 21. https://www.isna.ir/news/96120200432/
-
- Krätke, S. 2014. “Cities in Contemporary Capitalism.” International Journal of Urban and Regional Research 38 (5): 1660–1677. doi:10.1111/1468-2427.12165.
-
- Madreseha, Iranian Schools Portal. 2019. “Maps.” Accessed 29 April 2019. https://www.madreseha.net/map-schools/
-
- Marx, K. 1990. Capital: A Critique of Political Economy. Vol. 1. Repr from 1976. Harmondsworth: Penguin. doi:10.1099/00221287-136-2-327.
-
- Mehr News. 2017. “بازار داغ هواپیمای شخصی [The Booming Private Jets Market].” June 22. Accessed 16January 2018. mehrnews.com/news/4011717
-
- MHME, HIO (Ministry of Health and Medical Education, Health Insurance Organisation). 2018. “تعرفه های خدمات درمانی دولتی [Tariffs].” April 18. Accessed 26 March 2019. https://tinyurl.com/urqwxs7
-
- MHME (Ministry of Health and Medical Education). 2019. “اهداف و شرح وظایف [Goals and Duties].” Accessed 26 March 2019. https://tinyurl.com/qvshlrx
-
- Momeni, F. 2016. “Interview with Sepideh Eskandari.

 . [Farshad Momeni: Existing Institutions’ Structure Is against the Industrialists and People].” Sobhanpress.ir, May 4. Accessed 23 July 2016. http://arassnews.ir/fa/news/379
- Momeni, F. 2016. “Interview with Sepideh Eskandari.
-
- Morahem. 2015. “منطقه ای عجیب در تهران با اختلاف طبقاتی وحشتناک. [An Odd Neighborhood in Tehran with an Extreme Class Gap].” July 20. Accessed 16 August 2016. http://www.morahem.com/majale/terrible-gap-in-tehran/
-
- MPOT (Management and Planning Organisation of Tehran). 2014. ضریب جینی. [Gini Coefficient]. Accessed 11 August 2016. http://amar.thmporg.ir/
-
- MRUD (Ministry of Roads and Urban Development, News Agency). 2017. “
 [FSR Allowances and Municpalities]”. May 11. Accessed 16 March 2019. http://news.mrud.ir/print/38270
- MRUD (Ministry of Roads and Urban Development, News Agency). 2017. “
-
- Omidi, R. 2015. “عدالت آموزشی، دستاورد سیاست گزاری اجتماعی [Educational Justice, Social Policy Achievement].” Shargh Special Issue: Economics 2529: 42–43.
-
- Peck, J., and N. Theodore. 2007. “Variegated Capitalism.” Progress in Human Geography 31 (6): 731–772. doi:10.1177/0309132507083505.
-
- Raisdana, F. 2001. بررسی های کاربردی توسعه در اقتصاد ایران [Studies in the Iranian Economy and Development]. Tehran: Cheshmeh Publications.
-
- Raisdana, F. 2002. اقتصاد سیاسی توسعه [Political Economy of Development]. Tehran: Negah.
-
- Raisdana, F. 2016a. “مسکن، بافت شهری و شکاف طبقاتی, [Housing, Urban Fabric and Class Gap]”. March 9. Accessed 23 July 2016. https://tinyurl.com/u9mzpug
-
- Raisdana, F. 2016b. “ملاحظاتی درباره دستمزد. [Considerations on Wages]”. May 30. Accessed 27 July2016. https://tinyurl.com/rj78sja
-
- Sadvandian, S., and M. Etehadieh. 1989. آمار دارالخلافه تهران [Tehran Statistics, 19th Century]. Tehran: Tarikh Iran Press.
-
- Samair. 2018. “برنامه تغییر فروش تراکم [FSR Allowances for 2018]”. February 27. Accessed 26 March 2019. http://samair.ir/fa/save/48941
-
- Schott, J.J. 2006. Economic Sanctions, Oil, and Iran. Washington: Peterson Institute for International Economics. http://www.iranwatch.org/sites/default/files/us-congress-jec-schott-iran-energy-072506.pdf
-
- SCI. 2018. “نرخ بیکاری [Unemployment Rate]”. November 22. Accessed 20 March 2019. https://www.amar.org.ir/news/ID/5604
-
- SCI (Statistical Center of Iran). 2017. “Summary Results of the Iranian Urban and Rural Household Income and Expenditure Survey.” Accessed 20 March 2019. https://www.amar.org.ir/Portals/1/releases/heis/Household_Income_and_Expenditure_Survey_1396.pdf
-
- Shaikh, A. 2016. Capitalism: Competition, Conflict, Crises. Oxford: Oxford University Press.
-
- Smith, N. 1986. “On the Necessity of Uneven Development.” International Journal of Urban and Regional Research 10 (1): 87–104. doi:10.1111/j.1468-2427.1986.tb00006.x.
-
- Smith, N. 2010. Uneven Development: Nature, Capital, and the Production of Space. 3 ed. London: Verso.
-
- SNN (Student News Network). 2018. “

 [Deputy Minister of Health and Medical Education: 80% of the People Cannot Afford Private Hospitals]”. December 22. Accessed 26 March 2019. snn.ir/00353Z
- SNN (Student News Network). 2018. “
-
- Taraz News. 2013. “واردات چه کالایی بیشترین سود را دارد. [Highest Yielding Product to Import]”. July 13. Accessed 16 August 2016. http://www.taraznews.com/content/38547
-
- TCCIMA. 2017. “شاخص های اقتصادی استان تهران [Tehran Economic Indicators].” Accessed 26 April 2019. http://tccim.ir/images/Docs/TCCIMirBizReport_455.pdf
-
- TCCIMA (Tehran Chamber of Commerce, Industries, Mines and Agriculture). 2014. “
 . [Survey of Household Expenditure and Income in Tehran Province and the Country].” Accessed 9April 2018. http://tccim.ir/images/Docs/EcoReport36.pdf
- TCCIMA (Tehran Chamber of Commerce, Industries, Mines and Agriculture). 2014. “
-
- Tehran Municipality. 2019. “شرح وظایف [Duties and Responsibilities]”. Accessed 26 March 2019. http://region8.tehran.ir/Default.aspx?tabid=559
-
- TMICTO (Tehran Municipality ICT Organisation). 2014-2015. 1393 تهران شهر آمارنامه. [Tehran Statistical Yearbook 2014-2015]. Tehran: Tehran Municipality ICT Organisation.
-
- TMTO (Tehran Municipality Traffic Organisation). 2015. گزیده آمار و اطلاعات حمل و نقل شهری تهران [Annual Statistics]. Tehran: Tehran Municipality Traffic Organisation. Accessed 29 April 2019. https://tinyurl.com/u9v69xy
-
- UNMDGs. 2015. “Goal 2: Achieve Universal Primary Education.” Accessed 16 August 2016. http://www.un.org/millenniumgoals/education.shtml
-
- Ward, C., and M.B. Aalbers. 2016. “Virtual Special Issue Editorial Essay: “The Shitty Rent Business”: What’s the Point of Land rent Theory?” Urban Studies 53 (9): 1760–1783. doi:10.1177/0042098016638975.
-
- Weekly Standard. 2018. “The Other Iran.” January 12. Accessed 16 January 2018. http://www.weeklystandard.com/the-other-iran/article/2011133
-
- World Atlas. 2016. “Populations of 150 Largest Cities in the World.” March 7. Accessed 21 July 2016. http://www.worldatlas.com/citypops.htm
- The World Bank. 2016. “Urban Population (% of Total).” Accessed 4 April 2018. https://data.worldbank.org/indicator/SP.URB.TOTL.IN.ZS?locations=IR
Comment here